Influence Matrix
- desk-based
- hours timescale
- low resource requirement.
Influence matrix, also known as cross-impact analysis, impact matrix, networked thinking method, sensitivity model, is a forecasting method to assess cause-and-effect relationships within complex, nonlinear systems. The methods assesses interactions among items/variables of a system by using an orthogonal matrix. The method was originally developed by Gordon & Hayward (1968), simplified and modified by Vester (1976), Godet (1979), Vester (2002), and implemented in a planning and management software for complex systems “Sensitivity Model Prof. Vester®” (Malik Management Zentrum 2014).
- Should I use an Influence Matrix?
An influence or impact matrix should be considered as a preliminary step towards system dynamic modelling, because it helps focus attention and (limited) resources on the critical variables/factors that have the greatest influence on the system. The matrix provides a tool to frame the system under investigation and allows, by using a qualitative metric (i.e. system-wide influence), to combine factors or variables that are not necessarily equivalent and cannot necessarily be quantified (e.g. biophysical and socio-economic). Quantitative scores can be developed for subsets of a system (see Cole 2006). Vester suggested selecting between 15-30 variables (in Northrop & Connor 2017) while others suggest more than 50 variables may be needed. Cole (2006) reports requiring 3-3.5 hours to score a 28 x 28 influence matrix. Like all representations of reality, the influence matrix will never include all factors/variables of the whole system, and will include only those variables perceived as important by experts involved in the assessment. The influence matrix is only one of four steps in a participatory iterative process that includes problem definition, factor/variable selection, matrix scoring and matrix evaluation (Cole 2006).
- How do I use Influence Matrices?
The crucial first step is to identify a system’s critical variables to be evaluated, i.e. what is the question or problem context.
The methods assesses interactions among items/variables of a system by using an orthogonal matrix and at each row/column intersection scores the question: if the event in the row was to occur, how would it affect the probability of occurrence of the event in the column? Interactions at each row/column intersection can simply be scored as being unrelated, enhancing or inhibiting, or scored as probabilities or levels of influence. The impact of each variable is evaluated in terms of how strong is the influence to change the other variables.
Vester differentiates among four levels of influence, namely:
- 0 = negligible impact, a strong change of variable A causes no or hardly a change of variable B;
- 1 = disproportionately small impact, a strong change of variable A causes only a weak change of variable B;
- 2 = proportional impact, a change of variable A causes equivalent change of variable B;
- 3 = disproportionately high impact, a weak change of variable A causes a strong change of variable B.
Scores look at downstream and upstream system-wide influences of variables. Alternative scorings have been suggested, e.g. ranging from 0-5, those scoring each interaction as critical, passive, active or buffer, or continuous scores rather than distinct groups (see Cole 2006). The scores in each row and column are summed (called active and passive sums, respectively), to provide an indication of the strength of a given variable in influencing the performance of the whole system and the degree to which a given variable responds to the whole system’s variables. The row and column sums help to assess what each variable/factor contributes to the entire system, e.g. the quotient score, i.e. the ratio of active (row) and passive (column) sums, helps identify whether a factor is active or passive (high quotients scores indicate active factors that have a strong influence on other factors) and the multiplier score, i.e. the product of active and passive sums, indicates whether a factor is critical or buffer (critical factors influence and are influenced by other factors, buffer factors have intermediate multiplier scores).
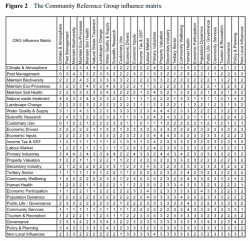
Figure 1. An Influence Matrix Example from Cole et al. 2007
- Examples of Bibliometrics in Sustainability Research
Cole et al. (2007) Participatory Modelling with an Influence Matrix and the Calculation of Whole-of-System Sustainability Values. International Journal of Sustainable Development 10(4): 382-401
Krieger M et al. (2017) Capturing systemic interrelationships by an impact analysis to help reduce production diseases in dairy farms. Agricultural Systems 153: 43-52.
Monsalud A et al. (2015) Greenhouse gas emissions mitigation strategies within the airport sustainability evaluation process. Sustainable Cities and Society 14: 414-424.
Priester et al. (2014) A generic code of urban mobility: how can cities drive future sustainable development? Transportation Research Procedia 4: 90-102
Scharlemann JPW, Mant RC, Balfour N, Brown C, Burgess ND, Guth M, Ingram DJ, Lane R, Martin J, Wicander S, Kapos V (2016) Global Goals Mapping: The Environment-human Landscape. A contribution towards the NERC, Rockefeller Foundation and ESRC initiative, Towards a Sustainable Earth: Environment-human Systems and the UN Global Goals. Sussex Sustainability Research Programme, University of Sussex, Brighton, UK and UN Environment World Conservation Monitoring Centre, Cambridge, UK.
Wiek A and Binder C (2005) Solution spaces for decision-making – a sustainability assessment tool for city regions. Environmental Impact Assessment Review 25: 589–608.
- References and Resources
Cole A (2006) The Influence Matrix Methodology: a technical report. Landcare Research Contract Report LC0506/175, Landcare Research,
Godet M (1979) The crisis in forecasting and the emergence of the “prospective” approach with case studies in energy and air transport. Pergamon Press, New York.
Gordon TJ & Hayward H (1969) Initial experiments with the cross impact matrix method of forecasting. Futures 1(1): 100-116.
Malik Management Centrum (2014) Malik Sensitivity Model®Prof. Vester. The computerized system tools for a new management of complex problems. http://www.frederic-vester.de/uploads/InformationEnglishSM.pdf
Northrop RB & Connor AN (2017) Application of Complex Systems Thinking to Solve Ecological Sustainability Problems. Chapter 8 in Northrop RB & Connor AN Ecological Sustainability: Understanding Complex Issues. CRC Press
Vester F (1976) Urban cities in crisis: understanding and planning human living spaces: the biocybernetic approach. Deutsche Verlags Anstalt, Stuttgart.
Vester F (2002) The art of interconnected thinking: Tools and concepts for a new approach to tackling complexity. DTV München [NB: an English summary and review is available by Ulrich W (2005) Can nature teach us good research practice? A critical look at Frederic Vester’s bio-cybernetic systems approach. Journal of Research Practice 1(1): R2. http://jrp.icaap.org/index.php/jrp/article/view/1/2.
- SSRP projects using Influence Matrices
Suggested citation: Scharlemann, J. (2019). Influence Matrix [online] Sussex Sustainability Research Programme Research Methods for Sustainability Catalogue. Available at: http://www.sussex.ac.uk/ssrp/resources/research-methods/influence-matrix.