Network Analysis
- desk-based
- week-month timescale
- low resource requirement.
Network Analysis uses networks to represent relationships between objects of analysis. The basic components of a network are the nodes (objects of analysis like species, individuals, organisations, etc.) and the links between them (relationships like co-authorship, predator-prey, financial transactions, etc.). Once a network is constructed, it can be analysed descriptively by looking at network structures or statistically using a number of network-statistic concepts to understand the overall dynamics of a system.
- Should I use an Network Analysis?
Network analysis is inherently relational and structural; the analytical reference is the structure of the network itself and the relations which compose it. This makes network analysis particularly suited to investigations of systems or of communities where the focus is on structure.
In addition, network analysis can be used both descriptively and statistically meaning that it is of use to both qualitative and quantitative researchers alike. This mixed-method approach provides an excellent basis for discussion across the qual-quant camps and can encourage researchers to develop mixed-method approaches.
Where network analysis falls down is in its explicitly structural approach. This viewpoint is useful for analysing the network structures and how individuals relate to one-another broadly, but does not necessarily provide thick description of what each of those relationships are. In addition, the overall dynamics may have structural drivers but the approach does not give much insight into the agency of its components.
- How do I use Network Analyses?
The first step in any network analysis is defining the network components. What are the nodes and edges? For nodes, this could be a particular species, an organisation, an individual, etc. These nodes could even be classified further with graphical indicators like shape and colour (see Fig 1). For edges, these could be financial transactions, symbiosis, predator-prey relations, communication, etc. Edges can also be differentiated with graphical indicators like length, thickness, direction, and colour (see fig 1).
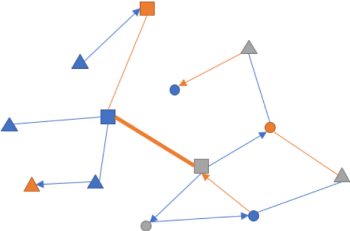
Figure 1. An example of a network. Different colours and shapes represent different node characteristics like age, rage, species, family, genus, particle, etc. and different line colours and arrows give direction and classification to the edges. Thicker edges are stronger connections than thinner connections.
Once the boundaries of what is (and isn’t) included in the network, the next step is to actually collect the data. This can be done either through fieldwork or through desk-based methods. For example one could use bibliometric data to produce a network of co-authorship. The important factor, however, is that the data needs to be collected on how each individual node relates to every other node. This data can be represented either as a matrix (Fig. 2a) or as separate node and edge lists (Figs. 2b & 2c), but both would produce the same network.

Figure 2a. Matrix of Co-authorship
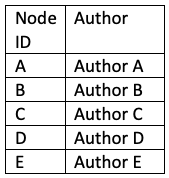
Figure 2b. Node List based on 2a
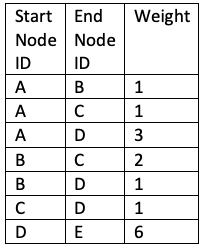
Figure 2c. Edge List based on 2a
The next step is to import this data into a programme which will produce network visualisation like VosViewer, Gephi, Pajek, Python, or R. This will produce a network which can be qualitatively analyses or statistically analysed or both.
In terms of qualitative analysis, network structures relevant to analysis depend upon the conceptual framework but might include triads (three nodes connected together), brokerage links (two nodes connected only via third node), isolates (nodes without connections), node clusters, or core versus peripheral nodes.
For quantitative analysis, however, there are some concepts which allow for more in-depth analysis:
- Centrality – Often equated with importance or influence, centrality is a group of measures which calculate how ‘central’ a node is to a network, i.e. how well-connected a node is.
- Clustering – This measure calculates the likelihood that two of a node’s connected nodes are also connected to one another, often translated to how embedded a node is in a cluster.
- Density – This is a raw measure of the number of connections in a network divided by the total mathematically possible number of connections. Density can also be calculated locally to each node and produce a density ‘heat map’ for a network.
- Distance – The minimum path length between two nodes. This can also be calculated using arc weights, rather than simple path number.
Any of these statistical measures can also be validated using an Exponential Random Graph Model (ERGM) which compares the existing graph to a randomly generated graph with similar features. This produces what is in effect a p-value for the likelihood that the observed graph is produced by chance, rather than by a treatment effect.
- Examples of Network Analyses in Sustainability Research
- Kajikawa, Y., Ohno, J., Takeda, Y., Matsushima, K. and Komiyama, H., 2007. Creating an academic landscape of sustainability science: an analysis of the citation network. Sustainability Science, 2(2), p.221.
- Bodini, A. and Bondavalli, C., 2002. Towards a sustainable use of water resources: a whole-ecosystem approach using network analysis. International Journal of Environment and Pollution, 18(5), pp.463-485.
- Almahmoud, E. and Doloi, H.K., 2015. Assessment of social sustainability in construction projects using social network analysis. Facilities, 33(3/4), pp.152-176.
- Dalsgaard, J.P.T., Lightfoot, C. and Christensen, V., 1995. Towards quantification of ecological sustainability in farming systems analysis. Ecological engineering, 4(3), pp.181-189.
- References and Resources
- Scott, J., 1988. Social network analysis. Sociology, 22(1), pp.109-127.
- Borgatti, S.P., Mehra, A., Brass, D.J. and Labianca, G., 2009. Network analysis in the social sciences. science, 323(5916), pp.892-895.
- De Nooy, W., Mrvar, A. and Batagelj, V., 2018. Exploratory social network analysis with Pajek: Revised and expanded edition for updated software (Vol. 46). Cambridge University Press.
- De Nooy, W., Mrvar, A. and Batagelj, V., 2018. Exploratory social network analysis with Pajek: Revised and expanded edition for updated software (Vol. 46). Cambridge University Press.
- Hunter, D.R., Handcock, M.S., Butts, C.T., Goodreau, S.M. and Morris, M., 2008. ergm: A package to fit, simulate and diagnose exponential-family models for networks. Journal of statistical software, 24(3), p.nihpa54860.
Suggested citation: Moon, J.R. (2019). Network Analysis [online] Sussex Sustainability Research Programme Research Methods for Sustainability Catalogue. Available at: http://www.sussex.ac.uk/ssrp/resources/research-methods/network-analysis.