Brexit and the regions: a lighter shade of dark
L. Alan Winters is Professor of Economics at the University of Sussex, and director of the UK Trade Policy Observatory. Nick Jacob is an associate tutor and research student in economics – also at the University of Sussex.
Few doubt that Brexit poses some immense challenges for the British economy. But for a government that professes to want an economy that ‘works for everyone’ there is possibly one encouraging factor: Brexit seems likely to help re-balance the economy. This note asks what Brexit implies for different parts of the UK and suggests two reasons why regions outside London and the South East could be less severely challenged.

Regions such as the West Midlands are relatively less reliant on EU exports than London and the South East. Photo by West Midlands Police from West Midlands, United Kingdom [CC BY-SA 2.0 (http://creativecommons.org/licenses/by-sa/2.0)], via Wikimedia Commons
Brexit is very likely both to re-orient UK international trade away from the EU and to change its commodity composition. Changes in the direction of trade can change the location of economic activity within the UK even without changes in composition, and Brexit is likely to boost manufacturing relative to services which will also favour the regions in a relative sense.
Whom we trade with
Why would supplying different markets affect the location of economic activity in the UK? Simply, distance matters. The EU is clustered around the south and east coasts of Britain, so trade with it tends to use eastern and southern ports. As a result, access to EU-produced intermediate imports and EU export markets is easier from the south and east while import competition is fiercer. As trade re-orients away from the EU, these forces will be partially reversed.
Brexit is in the future, of course, and we don’t yet know exactly what it will look like, but we can extract a little information from how economic activity relocated when Britain joined the Common Market in 1973. This has been studied in some detail in two papers co-authored with Henry Overman in 2005 and 2011.
Between 1970-72 (pre-accession) and 1990-92, the share of UK trade with Western Europe increased by around 19 percentage points and the share going through the ports of south-east England by around 15 percentage points. The share using the port of Dover increased from 4 per cent to 17 per cent and, in terms of the ports it used, trade in nearly every commodity shifted towards the South East. That is: access to export markets and intermediates and import competition shifted south-eastwards.
As trade with the EU becomes relatively less important, the north and west will benefit relative to the south.
We studied employment in 62,000 firms between 1970 and 1992, combined into 80 industries. A quarter of these industries showed a significantly positive effect on employment from access to export markets (including, for example, instrument engineering), a quarter positive effects from access to foreign intermediates (including motor vehicles) and another quarter negative effects from import competition (including industrial engines).
As trade with the EU becomes relatively less important, the north and west will benefit relative to the south. We do not know for sure how reversible these effects are or what trade deals the UK will get, but these results show that the geographical pattern of trade affects the geographical distribution of employment.
But remember, of course, that relative gains outside London do not necessarily mean absolute gains; there will have to be strong increases in trade outside Europe to compensate for losses within it if the net effect on trade and incomes is to be positive.
What we trade
Trade agreements also affect what we trade. Exiting the EU Single Market would pose challenges for all sectors, but arguably more for services than for manufacturing, because trade barriers in Europe and elsewhere are generally higher for services than goods. Thus Brexit seems likely to shift export demand relatively towards manufacturing. How will this affect different regions?
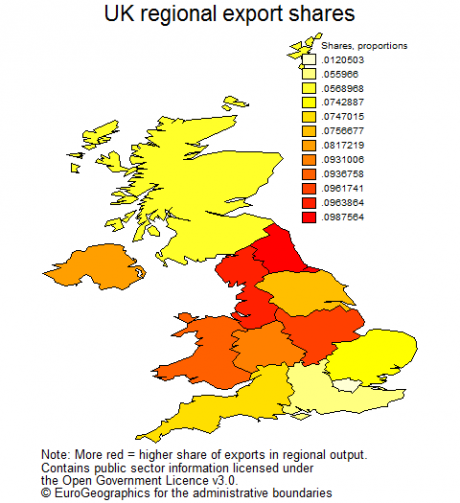
Table 1 tells us the share of income in each region that stems from manufacturing and roughly how important exports are to incomes deriving from manufacturing.
Manufacturing makes the largest percentage contributions to regional income in the East Midlands and Wales, with the North West, North East, West Midlands and Northern Ireland not far behind: the real outliers are the much lower shares in London and the South East.
Table 1: Regional Incomes, Manufacturing and Exports
| Region | Income (2014, £bn) | Share due to manufacturing | Share due to manufactured exports | Share of EU in exports |
|---|---|---|---|---|
| North East | 47,702 | 15.20 % | 10.14 % | 48.04 % |
| North West | 149,869 | 15.56 % | 9.99 % | 49.41 % |
| East Midlands | 95,178 | 17.46 % | 9.81 % | 46.94 % |
| Wales | 54,336 | 16.98 % | 9.33 % | 47.59 % |
| West Midlands | 114,755 | 14.97 % | 9.15 % | 42.48 % |
| Northern Ireland | 34,384 | 15.60 % | 8.61 % | 48.14 % |
| East of England | 138,801 | 12.21 % | 7.86 % | 47.43 % |
| South West | 121,070 | 11.91 % | 7.72 % | 45.48 % |
| Yorkshire and the Humber | 106,467 | 14.72 % | 7.70 % | 50.78 % |
| Scotland | 123,543 | 11.53 % | 6.06 % | 49.40 % |
| South East | 239,698 | 8.76 % | 5.87 % | 48.48 % |
| London | 364,310 | 2.62 % | 1.27 % | 50.15 % |
We don’t know how much each region exports directly, but we do know what it produces and what share of each product is exported nationally. So, splitting manufacturing into 13 broad product groupings, we assume that the share of a region’s income in each product stemming from exporting is the same as the national share of output of that product that is exported, and so we can calculate a share of income due to manufacturing exports overall.
The North East and North West have the highest contributions from manufactured exports – i.e. are the most manufactured-export-intensive regions. While a tiny 1.3 per cent of London’s income comes from manufactured exports, the industrial core stretching from Wales and the Midlands to the North has shares above 9 per cent.
Thus, if Brexit increases the relative importance of manufactured exports, we should expect to see incomes in these latter places benefitting relatively. (But, again, remember this is relative not absolute gains: we have to be prepared for the possibility that exports to the EU decline faster than exports to other countries increase.)
In fact, we can go a little further. We can estimate the exports of each region to the EU and to non-EU markets. As we argued above, Brexit is likely to switch exports towards the latter and so is likely to benefit the West Midlands (for which EU exports are only 42 per cent of its total) relative to the South East (for which the EU has a 48 per cent share), for example, because it has a relatively larger engagement already in those non-EU markets.
View technical annex for sources and methodologies.
Friday 14 October 2016
Disclaimer:
The opinions expressed in this blog are those of the authors alone and do not necessarily represent the opinions of the University of Sussex or UK Trade Policy Observatory.


Mailing list
Sign up to receive updates on UKTPO activity.
←Back to the EU referendum hub
Technical annex
All data are for 2014 in current prices.
Income is defined by Gross Value Added in the region.
The share of income due to manufactured exports is
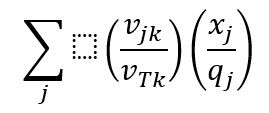
Where
j refers to manufactured product j (output of manufacturing sector j),
k to region
vjkto gross value added in sector j in region k
vTk to total gross value added in region k
xj to exports of product (sector) j
qjto gross output of product (sector) j
Sources: (1) ONS, Regional Gross Value Added (Income Approach), (2) UK Trade in goods by classification of product, (3) Input-output supply and use tables.
Contains public sector information licensed under the Open Government Licence v3.0.
© EuroGeographics for the administrative boundaries
http://www.ons.gov.uk/economy/grossvalueaddedgva/datasets/regionalgrossvalueaddedincomeapproach
http://ec.europa.eu/eurostat/web/gisco/geodata/reference-data/administrative-units-statistical-units