This page covers all aspects of the University of Sussex Community Observatory
Telescope: Location & Instructions
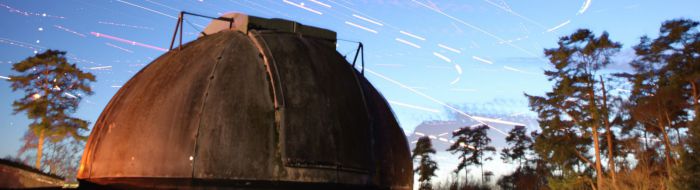
The University of Sussex Community Observatory is situated on the edge of the Cats Protection site in Chelwood Gate, near Haywards Heath (see Google maps).
Completed Projects
Below are competed projects carried out at the observatory with local students.
- Variable Star Observations with students from Sackville School, 2017-18
-
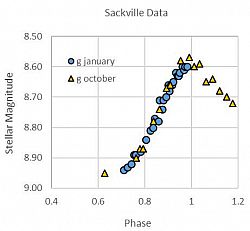
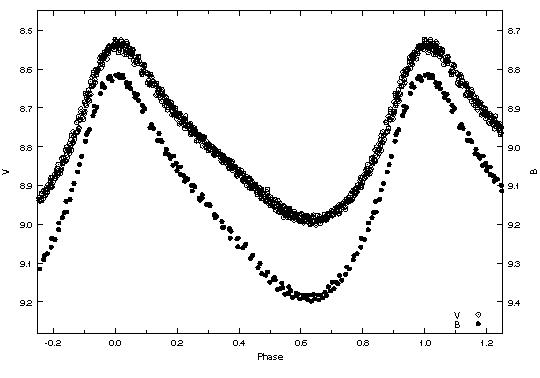
A-level students from Sackville School initially visited the University of Sussex for an introductory session of a series of short talks and practical sessions, coving topics such as why stars vary in brightness and how to use software to measure the brightness of stars. During the winter months, the students were able to collect and reduce data directly from the telescope on two occassions. Below are their results, compared to the published results of Wils, Van Cauteren & Lampens 2003. The Sackville School students collected data from the Sussex Community Observatory in both October 2017 and January 2018 giving a best fit period of 2.2611342 hours (2h 15m 40.08312s). This compares well with the published period of 2.2609442 hours (2h 15m 39.39912s).
This project is continuing in 2018/19, and both the University of Sussex and Sackville School would be delighted if other local schools would like to collaborate in this endeavour. Please contact us for details.
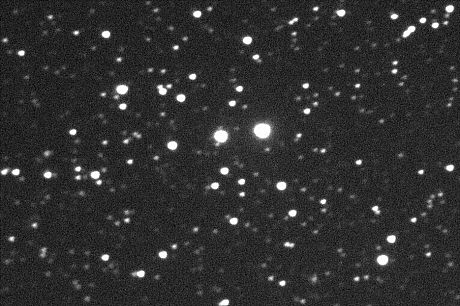
The target variable star, V2455 Cygnus, is the brightest star at the center of the image below. This image was taken by the Sackville School students using the Sussex Community Observatory.
Projects
There are a huge range of potential projects that can be carried out by the observatory. Our suggestions are listed below.
- Collecting Messier Deep-sky Targets
-
Charles Messier (1730-1817) was a French astronomer who was fascinated by comets and would go on to discover 20 previously unknown comets over the course of his life. During his comet-hunting efforts Messier found a significant number of celestial objects which had the fuzzy appearance of comets, but did not move across the sky as comets do. To ensure that they did not become distractions for future comet searches, Messier diligently catalogued all of these objects. Although he did not realise it at the time (astronomers would only be able to measure the distances to many of these objects more than a 100 years later), his list also included several dozen galaxies, some of which as far away as the Virgo galaxy cluster (distance to the Milky Way: ~55 million light years).
Plan: In this project you will explore what different types of galaxies look like. Use the list of galaxy coordinates to look up which Messier galaxies are visible during your observation run. (For your reference, the table also lists the distances to these galaxies, as well as their apparent brightness.) Try to make colour images of the galaxies in the Messier catalog by combining exposures taken with different colour filters. Do all objects have similar colours? Until what distance can you obtain good images of Messier galaxies, in which you can also make out some of the internal sub-structure of galaxies (e.g. bars or spiral arms)? Can you tell whether the shape of the galaxies you have observed is in any way related to their colour? You could also try to figure out which of the galaxies you have imaged has the largest intrinsic size.
#name	mag	distance [ly]	R.A.		Dec.
M31	3.4	2.5 million	00h 41.8m	+41° 16'
M32	8.1	3 million	00h 42.8m	+40° 52'
M33	5.7	3 million	01h 33.9m	+30° 39'
M49	8.4	60 million	12h 29.8m	+08° 00'
M51	8.4	37 million	13h 30m		+47° 11'
M58	9.7	60 million	12h 37.7m	+11° 49'
M59	9.6	60 million	12h 42m		+11° 39'
M60	8.8	60 million	12h 43.7m	+11° 33'
M61	9.7	60 million	12h 21.9m	+04° 28'
M63	8.6	37 million	13h 15.8m	+42° 02'
M64	8.5	19 million	12h 56.7m	+21° 41'
M65	9.3	35 million	11h 18.9m	+13° 05'
M66	8.9	35 million	11h 20.2m	+12° 59'
M74	9.4	35 million	01h 36.7m	+15° 47'
M77	8.9	60 million	02h 42.7m	+00° 02'
M81	6.9	12 million	09h 55.6m	+69° 04'
M82	8.4	12 million	09h 55.8m	+69° 41'
M83	7.6	15 million	13h 37m		-29° 52'
M84	9.1	60 million	12h 25.1m	+12° 53'
M85	9.1	60 million	12h 25.5m	+18° 12'
M86	8.9	60 million	12h 26.2m	+12° 57'
M87	8.6	60 million	12h 30.8m	+12° 24'
M88	9.6	60 million	12h 32.1m	+14° 26'
M89	9.8	60 million	12h 35.7m	+12° 33'
M90	9.5	60 million	12h 36.8m	+13° 10'
M91	10.2	60 million	12h 35.5m	+14° 30'
M94	8.2	15 million	12h 50.9m	+41° 08'
M95	9.7	38 million	10h 44m		+11° 42'
M96	9.2	38 million	10h 46.8m	+11° 49'
M98	10.1	60 million	12h 13.9m	+14° 55'
M99	9.9	60 million	12h 18.9m	+14° 26'
M100	9.3	60 million	12h 23m		+15° 50'
M101	7.9	27 million	14h 03.2m	+54° 21'
M102	9.9	40 million	15h 06.5m	+55° 46'
M104	8.0	50 million	12h 40m		-11° 37'
M105	9.3	38 million	10h 47.8m	+12° 35'
M106	8.4	25 million	12h 18.9m	+47° 19'
M108	10.0	45 million	11h 11.5m	+55° 40'
M109	9.8	55 million	11h 57.6m	+53° 23'
M110	8.5	3 million	00h 40.4m	+41° 41'
Note: The closest Messier galaxies, M31, M32 & M33 are too large to fit into the field of view of the Harold Robin Telescope. You may thus find it easier to make good images of the galaxies starting with M49 or higher Messier numbers.
- Observing Jupiter and the orbits of its brightest Moons
-
In January of 1610 Galileo observed Jupiter for the first time using the newly invented telescope and discovered its four brightest moons Callisto, Europa, Io & Ganymede. Repeat observations of Jupiter in the following days and months revealed that Callisto, Europa, Io & Ganymede were revolving around Jupiter in regular orbits. This realisation would be a crucial step in the Copernican revolution, whereby the long-held belief that the Earth was at the centre of the Universe was replaced by heliocentrism (i.e. the astronomical model placing the sun at its centre, with planets - including the Earth - rotating around it).
Jupiter is by far the largest planet of the solar system. It is more than three times as massive as the second largest planet, Saturn, and almost 318 times more massive than the Earth. It is not only the most massive but also the largest planet, with a diameter that is almost 10% of the diameter of the sun. The distance between Jupiter and Earth varies between 4 and 6.5 astronomical units (AU; 1 AU = 149.6 million km), depending on stage of their orbits around the sun.
Plan: Estimate the physical size of Jupiter by measuring its size on the CCD images taken with the Harold Robin Telescope. To do so, you will need to know the distance between Jupiter and the Earth on the day of your observation. You can read off this information on the website https://theskylive.com/jupiter-info#earthdistance . How easy is it to measure the angular size of Jupiter with the CCD camera? Is this best done with a long or a short exposure? How large do you think the error on your size measurement is? Once you have determined the size of Jupiter your next task will be to estimate the radius of the orbit of the Galilean moons Callisto, Europa, Io & Ganymede. You may require several observations to make this measurement. How is the radius of the orbit related to the time it takes each of the moons to complete a full rotation around Jupiter? Can you spot any further moons in addition to Callisto, Europa, Io & Ganymede? Use Stellarium to get the R.A. and Dec. of Jupiter for your specific dates.
- Building a mosaic of the Andromeda Galaxy
-
Just like the planets orbit the sun and the planets in turn have moons revolving around them, galaxies (esp. the larger ones) also often are accompanied by satellites of their own. The Milky Way has several satellite galaxies, the largest two being the Large Magellanic Cloud (LMC) and Small Magellanic Cloud (SMC). At a distance of roughly 2.5 million light years - i.e. 2.4x10^19 km - the Andromeda galaxy (which also goes by the name of M31) is the galaxy closest to the Milky Way which is not a satellite of our own galaxy. M31 is quite similar in size and mass to the Milky Way and is a also a disk-shaped spiral galaxy, just like the Milky Way. M31 and the Milky Way, together with their satellites form the so-called "Local Group" of galaxies. The Milky Way and Andromeda are being pulled toward each other due to their mutual gravitational attraction, and this collision course will cause them to merge in the distant future.
Plan: Because the Andromeda Galaxy is close to us (by cosmological standards!) its angular size on the sky is too large to fit into the field of view of the Harold Robin Telescope. The aim of this project is thus to produce a mosaicked image of M31 by stitching together multiple images. Based on the size of M31 listed in the data table and the field of view of the telescope (approx. [10.3 arcmin]x[6.9 arcmin]), how many separate images due you estimate will be required to cover the entire area of M31? What do you think would be the most efficient strategy for building up the mosaic? Is it necessary to take equal-time exposures over the full area of the galaxy or can you get by with shorter observations in some part of the galaxy? Are there particularly interesting regions/structures within M31 which catch your attention? What do you think causes the dark rings and arcs you may be able to see? If you have an opportunity you could also try to spot and observe the satellites of the Andromeda Galaxy, M32 & M33. Can you estimate how far away from Andromeda they are.
Data:

- Name: M31/Andromeda
- Position: 00h 41.8m	+41° 16'
- Apparent brightness: 3.4 mag
- Approximate diameter: 150 000 light years
- Approximate surface area: [180 arcminutes] x [60 arcminutes]
- Distance: 2.5 million light years
- Mass: ~100 billion solar masses (excl. dark matter)
- Star-formation rate: ~0.5 solar masses/yr
- Velocity with respect to Milky Way: -110 km/s (radial component)
- Estimating the number of craters on the Moon
-
On average, 33 tons of meteoroids hit Earth every day, the vast majority of which harmlessly burn up upon entering the atmosphere and never impact the Earth's surface. The Moon, however, has little or no atmosphere, so meteoroids have nothing to stop them from striking the surface. The slowest of these rocks travels at 20 km/s, the fastest at over 72 km/s. At such speeds even a small meteoroid has incredible energy - one with a mass of only 5 kg can lead to a crater over 9 meters across, thereby displacing up to 75 tons of lunar soil. The largest objects to have hit the moon may even have been powerful enough to inflict substantial damage to tis crust, such that the impact basin was subsequently filled by molten lava, thereby producing lunar maria. While the craters left behind by meteorites impacting the Earth are weathered down or covered up by vegetation, water or snow relatively quickly, lunar craters remain visible for billions of years. Many parts of the moon of even suffered meteorite impacts on several separate occasions, as evidenced by the fact that many large, old craters are themselves covered by smaller craters.
Plan: Your task is to take pictures of the moon and try to estimate how many impact craters there are on its surface. What is the actual, physical size of the smallest crater you think you can make out with the Harold Robin Telescope? Do you need to map the whole visible surface of the moon for your crater count estimate or can you think of a more efficient method? Would you expect the far side of the moon to have more or fewer craters? You could also attempt to figure out at what rate new impact craters appear on the moon. How would you go about estimating the crater formation rate? Use Stellarium or your usual planetarium software to get the R.A. and Dec. of the Moon for your specific date.
- Variable Stars
-
Amateur observers have made significant contribution to the field ofvariable stars. By monitoring regularly varing stars over extended periods of time, theis periods of variability can be determined to great accuracy. Monitoring irregularly varing stars could even lead to professional telescope around the worrl - or evven in space - to follow up on your observations.
Plan: Choose suitable stars for monitoring from the website of the American Association of Variable Star Observers (AAVSO). This site has a handy tool for selecting targets, the AAVSO Target Tool. Once observations have been made and reduced, data can be added to the AAVSO archive, and light curves plotted and fitted.
- Comet/asteroid tracking
-
Track the positions of asteroids and comets over longer time periods enables accurate orbital parameters to be determined.
Plan: Use the NASA/JPL Small-Body 'What's Observable?' tool to identify suitable targets for any given night. Observe one or more targets over several nights and fit orbital parameters.
- Supernova imaging
-
Attempt to photograph some of the most energetic but short-lived phenomena in the Universe. This may be your chance to be the first to pinpoint a rare Galactic supernova and make early observations!
Plan: Sign up for AstroAlerts at Sky & Telescope and wait for an alert! A typical AstroAlert will tell you what to look for, where and when to look, what kinds of observations are needed, and how and to whom to report your results.
- Detecting Exoplanets
-
Plan: Observe the dip in starlight caused when an exoplanet passes in front of its parent star.
This is best seen in bright stars where the exoplanet causes a large (few percent) dip in starlight. Using Exoplanet.org, you can easily plot a graph of V magnitude against Transit Depth.
This reveals the following potential targets:
- WASP 80b in the constellation of Aquila: V mag 11.5, 3% dip, visible Sep-Dec
- HD189733 in the constellation of Vulpecula: V mag 7.5, 2.5% dip, visible Aug-Dec
- WASP 69b in the constellation of Aquila/Aquarius: V mag 10, 1.8% dip, visible Sep-Dec
- HD209458 in theconstellation of Pegasus: V mag 7.5, 1.5% dip, visible Sep-Jan
- WASP 33b in the constellation of Andromeda/Perseus: V mag 8.5, 1.2% dip, visible Nov-end Feb
Note that generating this list of bright stars with deep dips is a good exercise for students - just visit exoplanets.org, select the two parameters to plot, and then hover your cursor over the data points to find the name of the star, which you then look up the co-ordinates for to see when it is visible.