Study with us
Explore our undergraduate, Masters and PhD courses.
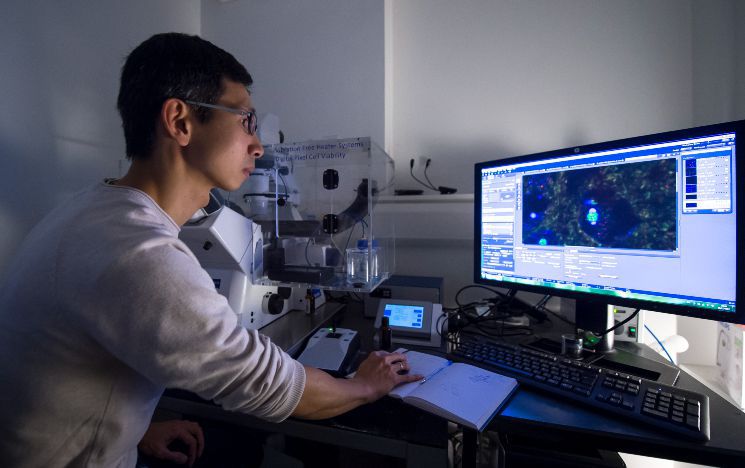
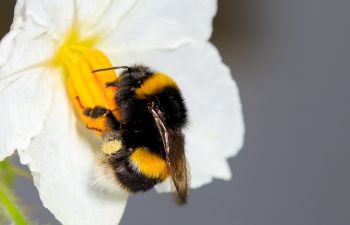
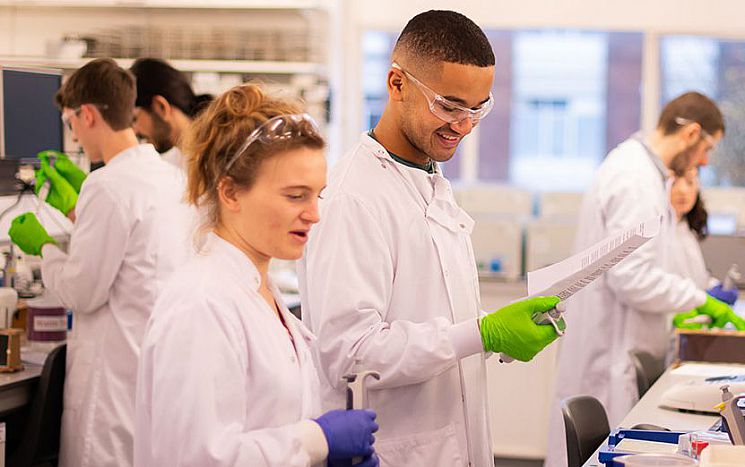
The School of Life Sciences is a diverse and collaborative community with expertise in areas as varied as cancer biology, drug discovery, neuroscience, biodiversity and conservation. Research lies at the heart of the School, and underpins our inspirational teaching.
Explore our undergraduate, Masters and PhD courses.
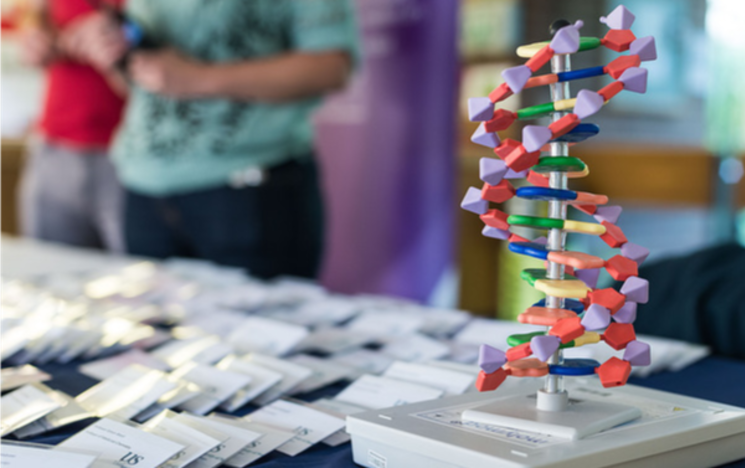
Discover how our diverse research makes a difference.
Learn about our values, committment to EDI and history.

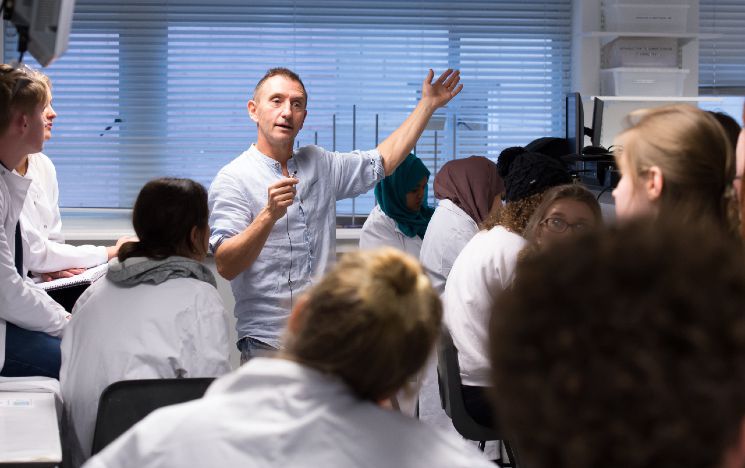
Find out how we engage with the public about our work.
Keep updated on the latest School news and events.
Meet the people who make up our community.
The School of Life Sciences is keen to attract and support the most outstanding researchers of the future. We welcome applications from promising scientists who have obtained, or would like to obtain, competitively-awarded Fellowships.
If you are interested in being sponsored for such an application, contact our Head of School, Prof. Michelle West; Deputy Head of School, Prof. Miguel Maravall; or the relevant Head of Department.
Find out more about our policy for the career development of Independent Research Fellows.
See information for current students and staff.
School of Life Sciences
John Maynard Smith (JMS) Building, Room 3B12a
University of Sussex, Falmer, Brighton, BN1 9QG
Email: lifesci@sussex.ac.uk.