Cliff retreat measurements
Measurement of the rate of cliff retreat along the coastline of East Sussex has been attempted in a number of previous studies (Figure 1).
|
Locality |
Time period |
Average
annual loss at cliff top in cm (figures with * have been calculated from
imperial measurements) |
Source |
|
Bexhill
and Glynde Gap |
1925-1955 |
~10 to ~20 |
Thorburn,
illustration nr. 8 5 |
|
Birling
Gap |
1875-1961 |
91 |
May,
page 203 |
|
Birling
Gap |
1875-1961 |
91 |
Castleden,
Table 3 |
|
Birling
Gap |
1955-1962 |
99 |
May,
page 203 |
|
Birling
Gap |
1950-1962 |
97 |
Castleden,
Table 3 |
|
Birling
Gap |
1973-1975 |
122 |
Castleden,
Table 3 |
|
Birling
Gap |
1925-1955 |
~90, maximum ~126* |
Thorburn,
illustration nr. 8 5 |
|
Birling
Gap (stretch 70m east and west of the steps) |
1873-1976 |
69 |
Cleeve
& Williams, Fig. 101 |
|
Cuckmere
Haven to Birling Gap |
1973-1975? |
125 |
Thorburn,
page 7 |
|
East
Sussex chalk cliffs |
n.a. |
30-50, maximum 125 |
Robinson
& Williams (1983) page 61 |
|
Ecclesbourne
Glen |
1872-1987 |
15 to 33³ |
Cleeve
& Williams, page 48 |
|
Fairlight
Cove (Haddock’s Cottage) |
1873-1986 |
57 to 774 |
Cleeve
& Williams, page 59 |
|
Hasting
to Cliff End |
1925-1955 |
~50, maximum 186* |
Thorburn,
illustration nr. 8 5 |
|
Peacehaven |
1973-1975 |
45 |
Castleden,
Table 3 |
|
Peacehaven
(Portobello to Maline Avenue South) |
1875-1967? |
45.7 |
Hove,
page 1 |
|
Peacehaven
(Maline Avenue South to Steyning Avenue) |
1875-1967? |
38.1 |
Hove,
page 1 |
|
Peacehaven
(Roderik to Steyning Avenue) |
1873-1976 |
29 |
Cleeve
& Williams, page 28² |
|
Peacehaven
(Steyning Avenue to Southdown Avenue) |
1875-1967? |
30.5 |
Hove,
page 1 |
|
Peacehaven
(Southdown Avenue to Cornwall Avenue) |
1875-1967? |
60.9 |
Hove,
page 1 |
|
Peacehaven
(Cornwall Avenue to Friars Bay) |
1875-1967? |
38.1 |
Hove,
page 1 |
|
Peacehaven
and Telscombe cliffs |
1973-1975? |
45 |
Thorburn,
page 6 |
|
Peacehaven
to Newhaven |
1925-1955 |
~30, maximum ~90 |
Thorburn,
illustration nr. 8 5 |
|
Seaford
Head |
1973-1975 |
30 |
Castleden,
Table 3 |
|
Seaford
Head to Beachy Head |
1872-1962 |
42 |
May,
page 203 |
|
Seaford
Head to Beachy Head |
1872-1962 |
42 |
Castleden,
Table 3 |
|
Beachy
Head to Eastbourne |
1925-1955 |
~20, Maximum ~106* |
Thorburn,
illustration nr. 8 5 |
|
Seaford
Head to Cuckmere Haven |
1973-1975? |
30 |
Thorburn,
page 7 |
|
Seaford
Head to Cuckmere Haven |
1925-1955 |
~30, maximum ~126* |
Thorburn,
illustration nr. 8 5 |
|
Seven
Sisters |
1873-1962 |
50.5 |
May,
table 1 |
|
Seven
Sisters |
1873-1962 |
51 |
Castleden,
Table 3 |
|
Seven
Sisters |
1973-1975 |
125 |
Castleden,
Table 3 |
|
Seven
Sisters |
1925-1955 |
~40 |
Thorburn,
illustration nr. 8 5 |
* see note 5
1 Cleeve and Williams (Fig. 8)
suggest a ‘fairly constant’ retreat rate based on measurements taken from maps
with survey dates 1873-74, 1908, 1925, 1960, 1976, 1987.
² Cleeve and Williams (Fig. 16) show the retreat
rate to be fairly constant based on measurements taken from maps with survey
dates 1873, 1899, 1926, 1960, 1976.
³ data for four profiles along 5km of coastline
4 data for three profiles along ~3km of coastline
5 retreat rates are estimated from the graph in Thorburn which
provides detailed retreat rates for the whole of the cliffed coastline of East
Sussex, maximum values with an * are taken from table 1, assuming the data
relates to the same time interval
Figure 1: Published rates of retreat along the East Sussex coast in the literature
Most measurements have been obtained by comparing the position of the coastline on maps of different ages by manually tracing the cliff lines from the maps, overlying the lines and then measuring the distance between the lines at a number of points. Only rarely has the area of cliff retreat been measured and a mean retreat rate for different lengths of coastline calculated (e.g. Cleeve & Williams 1983). The only comprehensive survey of the entire Sussex coastline is that of Thorburn (1977). Unfortunately this study was based on maps covering only the 30 year period 1925-1955, which is likely to introduce significantly larger errors due to positional errors on the maps, than if maps covering a longer time span are used. The method of manually tracing and overlaying introduces errors by itself (tracing errors, pencil width, shape changes of the paper). These errors are further aggravated by the necessity of enlarging or reducing maps to facilitate overlaying of maps of different scales (e.g. change from imperial to metric scales).
In the BERM project a consistent methodology using ArcView GIS was applied to the whole length of the chalk cliff coastline, thus producing the first truly comparable retreat rate estimates.
1.1 Present cliffline
As the modern data Ordnance Survey digital Landline data was kindly provided by East Sussex County Council for use in this project. The data was directly imported into ArcView without any alterations. The positional error of the OS Landline data depends on the scale at which it was surveyed and is only available as a gross figure (i.e. for whole map sheets). The OS provide accuracy statements for their data (Ordnance Survey 2000) where an accuracy of ± 0.5m is given for the survey scale 1:1250 and of ± 1.1m for the survey scale 1:2500. From a letter received from the Ordnance Survey (Appendix 3) the majority of the coastline was surveyed at a scale of 1:2500 thus the positional error of the Landline data is assumed to be ± 1.1m. The date for the cliffline position in the data was taken from the date of the airphotos on which the revision of the map sheets was based (figure 2).
|
Map
sheet number |
Dates
of air photographs used for revision of Landline data |
|
TQ3O |
8/4/97 |
|
TQ4O |
5/6/96 |
|
TQ8O |
16/3/99 |
|
TQ81 |
16/3/99 |
|
TV49 |
23/7/97 |
|
TV59 |
23/7/97 |
|
TV69 |
23/7/97 |
For the presently defended coast at Peacehaven maps surveyed prior to the installation of sea defences and the trimming of the cliffs were used. These comprise the Ordnance Survey maps at a scale of 1:10,000 surveyed in 1954 and ground surveys carried out on behalf on Lewes District Council in 1970 and 1996 (see map 1). These maps were scanned and referenced in a similar way to the historic maps (see below).
1.2 Historic cliffline
The earliest maps that could be used were the 1st Edition of the Ordnance Survey 6-inch scale maps (1:10,560) because these maps are the first to have been surveyed with regard to a geographical reference system that is displayed on the map itself.
Prior to scanning the graticule was transferred as small markers into the areas to be scanned using a long metal ruler so as to cause the least damage to the maps that are available as originals from University of Sussex Geography Resource Centre. Maps were then scanned at 300dpi using an A3 scanner. The maps were georeferenced to the National Grid in ArcView using the markers. Georeferencing was performed using a first order transformation with RMS-errors in most cases <0.6m. Line features such as the cliff top line the Mean High Water Line and Mean Low Water Line were then digitised by ‘head-up’ digitising in ArcView at a scale of 1:1000. The centre of the line as it appeared in the scanned image was used for digitising.
|
Map sheet number |
Survey years |
|
66 |
1873-75 |
|
77 |
1873 |
|
78 |
1873 |
|
79 |
1873-74 |
|
80 |
1875-76 |
|
81 |
1875 |
|
82 |
1875-76 |
Figure 3: 1st Edition Ordnance Survey 6-inch maps used
The survey accuracy of historic maps is not given though it is unlikely that it surpassed the accuracy of the modern Landline data set. The accuracy can therefore only be estimated by comparing features in both data sets.
1) Comparison of features in the Landline data and in the scanned and georeferenced historical maps (assuming that features such as houses or roads have not moved) indicate position variations between the two data sets from naught to several metres.
2) The cliffs seem to have advanced at 20 stretches along the cliff in the vicinity of Beach Head. Be-cause an advance is not physically possible these 'advances' must be due to survey inaccuracies of one or both of the data sets. The mean length of these stretches is 20 m and the mean advance over 124 years is 1.94 m with a maximum in one location of 7.49 m. If one assumes that the cliff line along these stretches has not changed at all between the two surveys, the observed mean ‘advance’ can be nearly accommodated by the positional error of ± 1.1 m of the Landline data (see above).
The RMS error for the georeferencing employed on all maps has a mean of ~ 0.6m. The comparisons, together with the assumption that former surveyors who worked on the ground have considered the cliff line as a feature worth surveying accurately as it represents an important feature, allows one (erring on the safe side) to assume a positional error for the historic cliff line of ± 5m.
The error for the distance measurements between 1st
Edition maps and the Landline data is therefore ![]() m. The average time interval between the surveys for the 1st
Edition OS maps and the air photos on which the Landline data is based is 124
years, resulting in an error for the annual retreat rate of ±0.04m / year.
m. The average time interval between the surveys for the 1st
Edition OS maps and the air photos on which the Landline data is based is 124
years, resulting in an error for the annual retreat rate of ±0.04m / year.
1.3 Cliff retreat
Annual retreat rates were calculated from the area lost between the two cliff lines of different age and position by dividing the area by the length of the cliff line and the number of years between the two surveys. To provide retreat rates on a small scale the length of the cliff was divided into 50m long segments. The length of 50m was taken to use the same interval as was used by the French partners of the BERM project.
1.4 Results
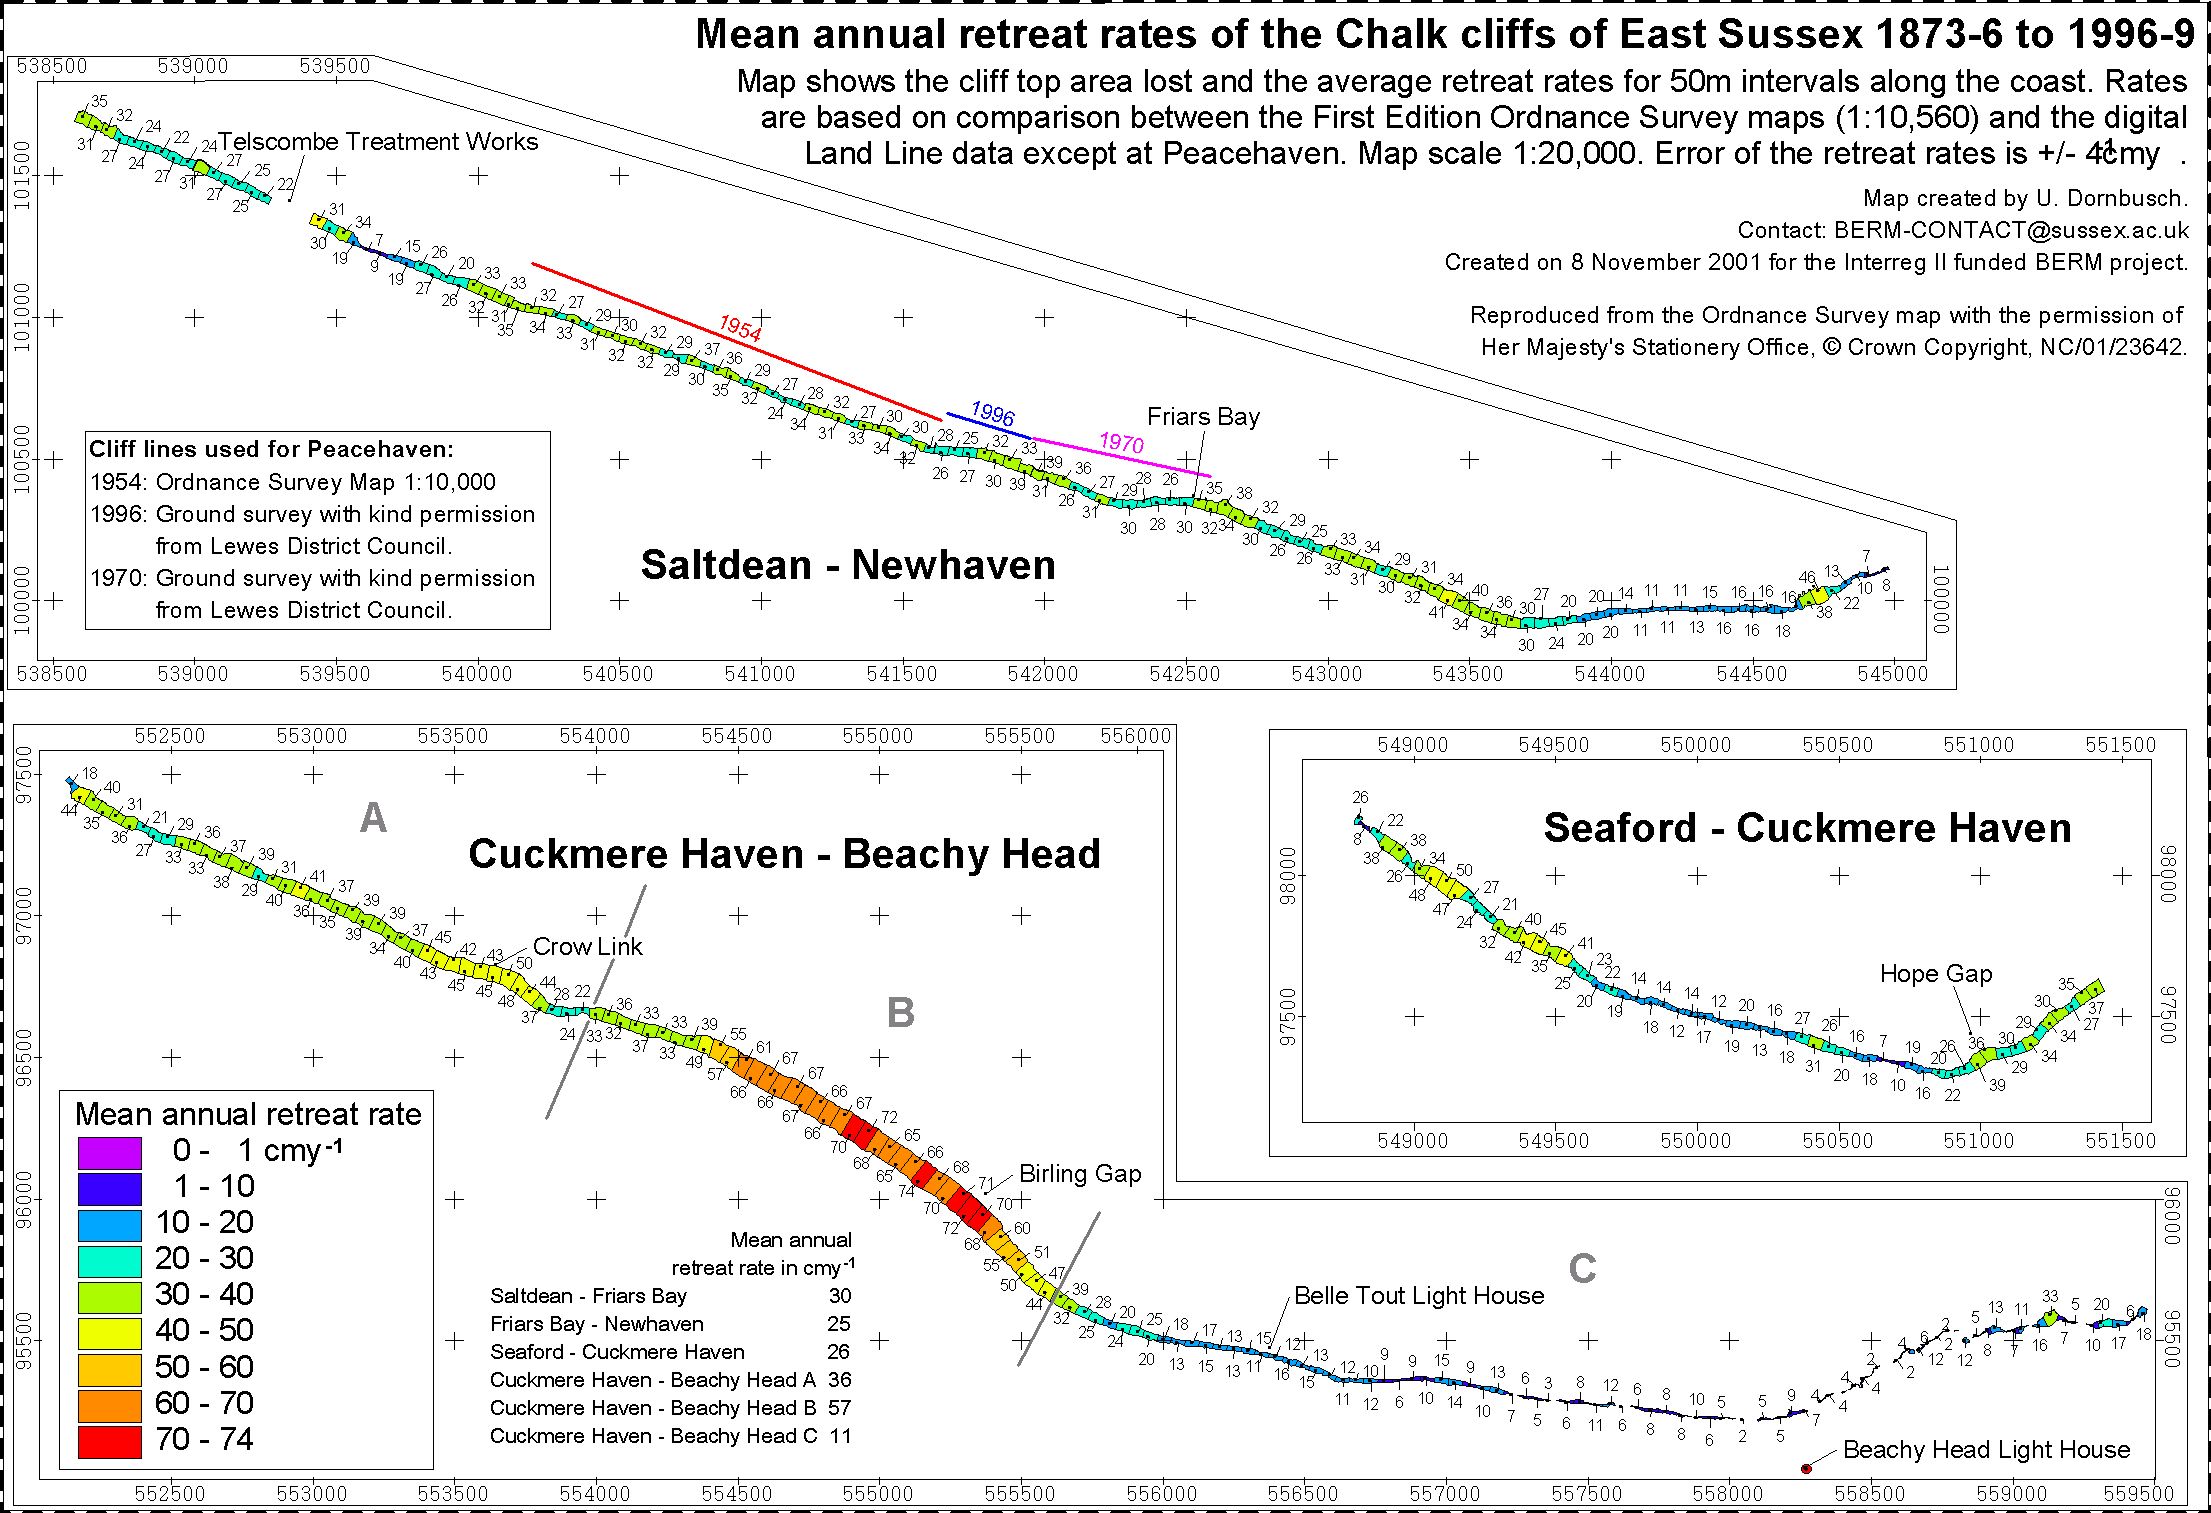
The map shows the mean annual retreat rates (click on the map to see a larger image, click here to a map showing only the cliffs from Seaford to Beach Head but with air-photos in the background for better orientation). Cliff retreat along the Saltdean to Newhaven stretch averages at 28cm y-1. Particularly low retreat rates are found just east of the Telscombe Treatment Works where a bay seems to develop between the treatment works and the developing promontory. Low retreat rates are also found west of Newhaven breakwater where parts of the cliff are protected through the shingle accumulation west of the breakwater. A change in the orientation of the coast, affording a less direct wave impact from south-westerly storm waves may partly explain the retreat rate decrease. That factors other than orientation towards predominant storm waves are likely to have an influence on the retreat rate can bee seen along the stretch Seaford to Cuckmere Haven where the southeast orientated coast east of Hope Gap abrades at nearly twice the rate of the central part with a south-southwestern orientation.
The Seven Sisters coastline, usually described as 'straight in plan' (Castleden 1996: 37), shows varying erosion rates, notably with high erosion rates at Crowlink and low rates east of Flagstaff Brow indicating a development away from the straight line. While interest regarding the highest erosion rates along the chalk cliffs of East Sussex is usually centred on Birling Gap (e.g. Cleeve & Williams, Castleden) the highest rate seems to be located about 200 m west of Birling Gap and erosion rates over 60 cm a-1 can be found for a stretch of over 1 km west of Birling Gap.
West of Birling Gap, towards the Belle Tout lighthouse the erosion rate decreases to values <10cm a-1 east of Belle Tout lighthouse. Given the error in the retreat of ± 4 cm a-1 it seems to be possible that larger parts of the Beach Head cliffs have not retreated at all over the last 124 years.
Possible factors influencing the retreat rate have been investigated. Assuming the wave energy is able to remove a given volume of cliff fall debris at the foot of a cliff at a 'constant' rate and that removal of the material is necessary to allow for renewed wave attack leading to another cliff fall, then the height of the cliff should be proportionate to the cliff retreat because higher cliffs produce a larger volume of debris than lower cliffs (see Sunamura 1992:105).
 A
A
 B
B
 C
C
There
is a significant correlation supporting the assumption that higher cliffs
retreat slower for the coast between Cuckmere Haven and Beach Head (C) but
judging from the other two sections (A, B) no correlation seems to exist
indicating that other factors may have a greater control over the rate of cliff
retreat. If a correlation is performed including the whole coast (N = 357
segments) r is significant with -0.499.
Seaford Head
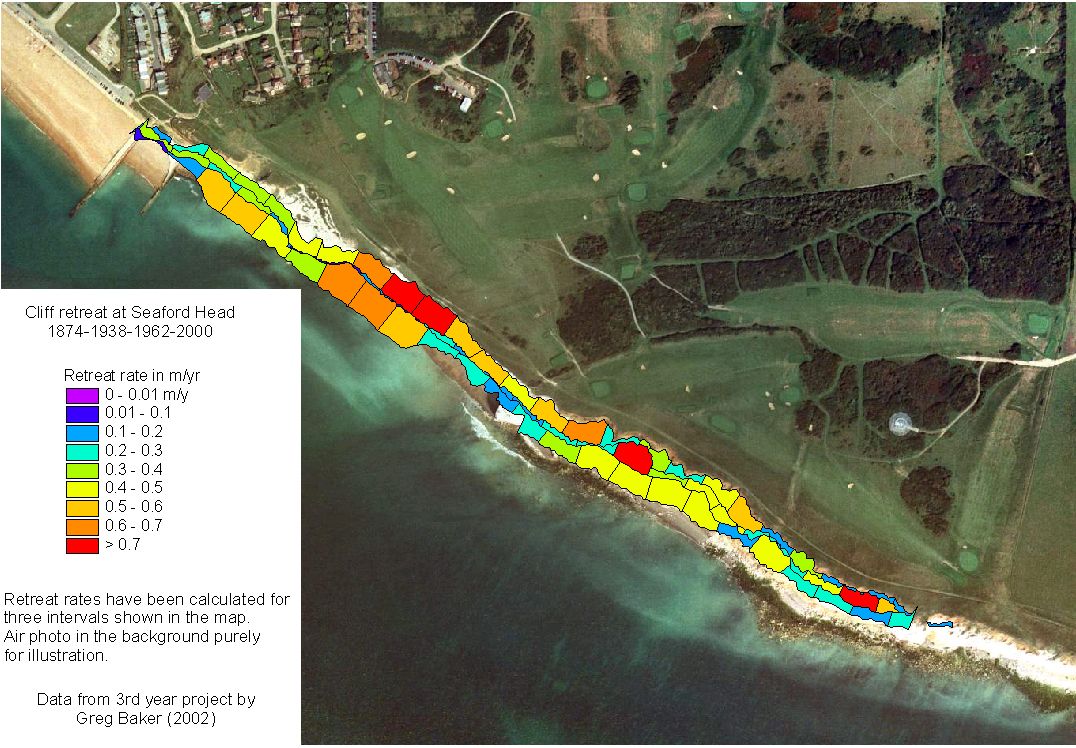
Temporal variations in the retreat rate can be inferred if the GIS method is applied to a series of maps for the same area. The 3rd year project by Gregory Baker (2002) applied the method to Seaford Head. With shorter time intervals between maps, however, the map error increases and the knowledge of the survey date of the cliff line, compared to the publication date of the map, becomes more important when calculating mean annual retreat rates.