Geography and Environmental Studies research
Find out about our Geography and Environmental Studies research.
Research impact
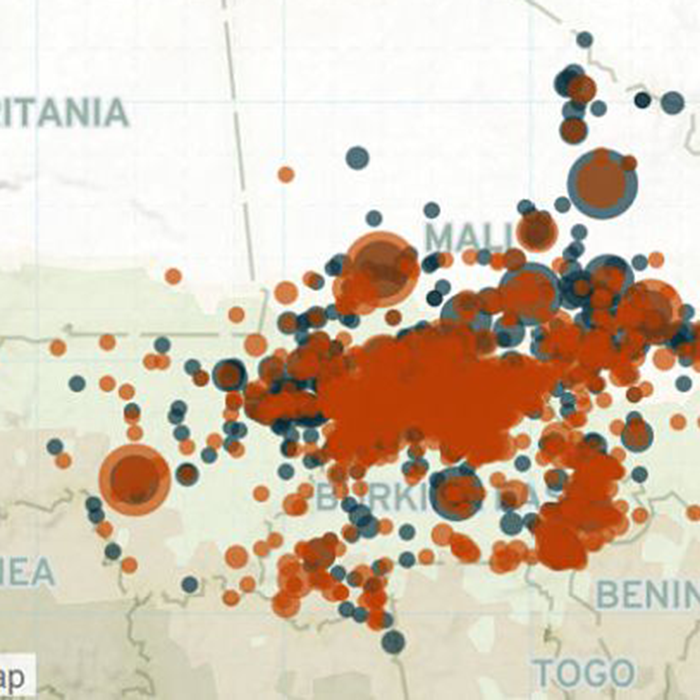
Re-shaping our understanding of political violence and conflict
Clionadh Raleigh, Professor of Political Geography and Conflict at the University of Sussex, has spent the past eight years collecting data related to violent incidents in order to re-shape the way we understand political violence and conflict.
Improving understanding of migrant experiences
Dr Sarah Scuzzarello is a member of the Sussex Centre for Migration Research (SCMR), and works to better understand why people choose to leave their home countries, and how they navigate identities and communities in new lands.
Read our interview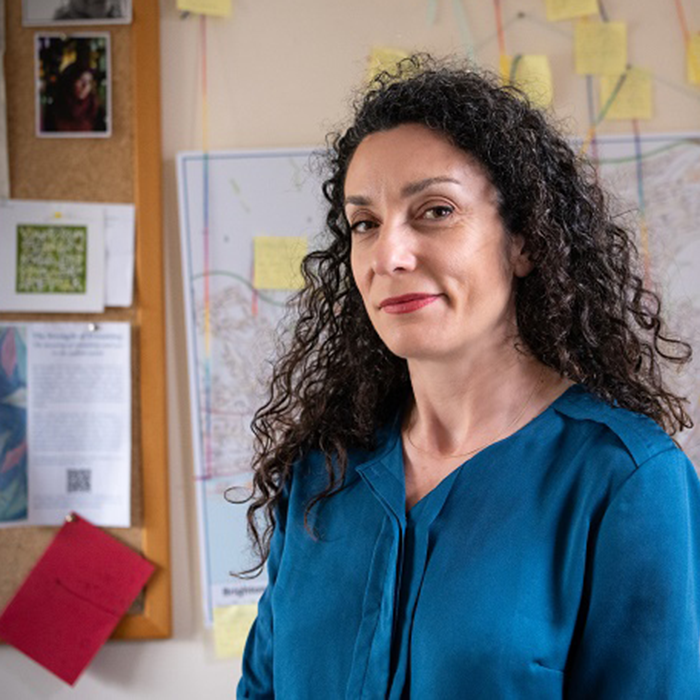
Dominic Kniveton: The Fun Way to Help Save the World
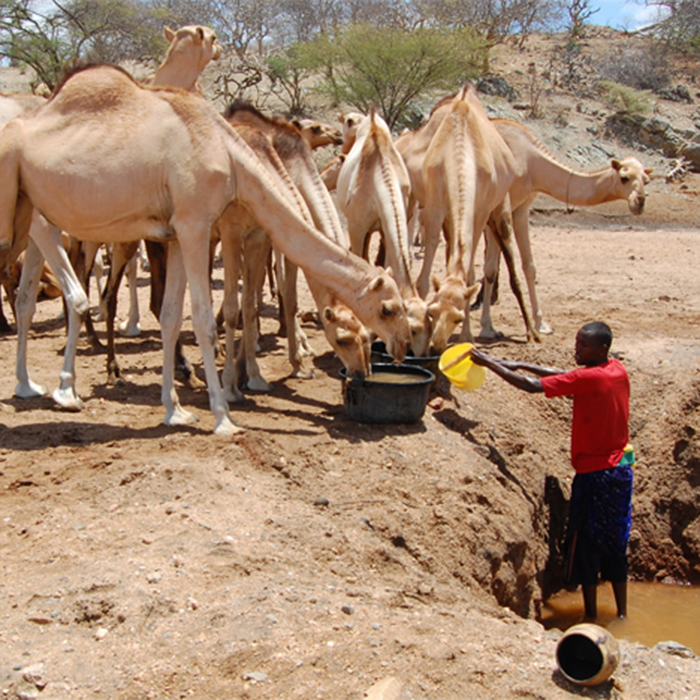
Forecasting for drought in Kenya
A collaboration between Sussex researchers, Kenyan national agencies and non-governmental organisations aims to improve drought predictions through the use of machine learning techniques to analyse satellite-based Earth observations.
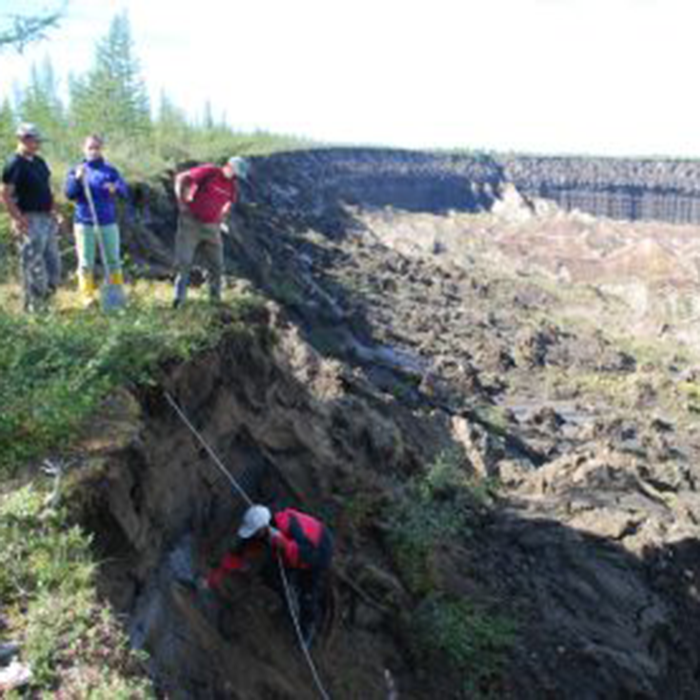
Studying permafrost to understand our changing climate
Sussex researchers venture to some of the coldest places on Earth to examine permafrost, which is a geological manifestation of climate. They also conduct experiments simulating permafrost conditions in our specialised laboratory on campus.
More research
- Research in our schools
School of Global Studies
Explore all research in the School of Global Studies.
Global Studies research activities are organised around the following departments and centres: - Research programmes and centres
- Centre for Advanced International Theory
- Centre for Cultures of reproduction, technologies and health
- Centre for Global Political Economy
- Centre for Poverty and Inequality Research
- Centre for the Analysis of Regional Integration at Sussex
- Sussex Centre for Conflict and Security Research
- Sussex Centre for Human Rights Research
- Sussex Centre for for the study of corruption
- Sussex Sustainability Research Programme
- Centre for Global Health Policy
- Centre for International Education
- Social, Technological and Environmental Pathways to Sustainabilty Centre
- Sussex Centre for Migration Research
- Sussex European Institute
- Sussex Africa Centre
- Sussex Asia Centre
- Social, Technological and Environmental Patways to Sustainabilty Centre
- Centre for Coastal Research
- Centre for Global Political Economy
- Centre for World Environmental History
- Sussex Energy Group
- Climate@Sussex
- Energy and Materials Chemistry
- Laboratory of Apiculture and Social Insects
- Centre on Innovation and Energy Demand
Contact us
Research development enquiries
researchexternal@sussex.ac.uk
Research impact enquiries
rqi@sussex.ac.uk
Research governance enquiries
rgoffice@sussex.ac.uk
Doctoral study enquiries
doctoralschool@sussex.ac.uk
Undergraduate research enquiries
undergraduate-research@sussex.ac.uk
General press enquiries
press@sussex.ac.uk