
Research findings in a digestible format
- July 2015 - Explaining How Family Structure Influences Growth
-
Typical Working Class Family

Explanations of change in children’s growth pattern in history can be divided into two categories.
- The first set of factors influence children’s health by directly contributing to the total amount of food available for one household.
- The second set includes factors determining how food, resource and workload are distributed among children within a household.
There is a large body of literature that shows how the first category drives up children’s growth in history, but our focus here lies in the latter.
The newly collected dataset from the North Surry School District (NSSD) is so far the only nineteenth century individual-level dataset that allows children’s growth pattern to be reconstructed in Britain. It contains information on heights and weights for 3,842 children, both girls and boys (1:1.35), who were born between 1866 -1892. More importantly, 53% of the children enrolled in the NSSD with at least some of their siblings, which provides us a unique opportunity to assess how various household structures may influence the allocation of resource among children in the late 19th century Britain.
To begin with, preliminary analysis using NSSD data show that there is a large within-household variation in terms of Z-score[1] for both height and weight (with the mean of difference in Z scores equals to 1.16, and a 1.04 standard deviation), indicating that children do not necessarily have similar health conditions within the same family. What factors may affect parent’s intentional or unintentional decisions on food, other resources and workload distribution among their children? Presumably, gender, the number of siblings, age gap between siblings and order of birth all have potentials impacts.
Holding the amount of resource constant for a household, the most obvious factors that affect the resource distribution include the size of the family and the age-band among children. We start our analysis by first comparing families with different number of siblings. Surprisingly, in this exercise, no trade-off between the quantity and quality of children has been observed. Instead, children who enrolled in the school alone had worse health conditions comparing with children who had other siblings admitted to school together. The correlation between a child’s health and the number of siblings is not linear, but an inversed U-shape, reaching its tipping point when the sibling number is 3. Of course, this finding requires further rigorous investigation, since the number of siblings we observe in the data is only a proxy for the actual household size. Parents’ decision on how many children and which specific child should be sent to schools are not random. Therefore, a systematic measurement error might exist if we adopt the number of siblings who enrolled in school as an indicator for household size.[2]
When we turn to another aspect of family structure -- age band between children, defined by the average age difference between a child’s immediate siblings, the findings show that controlling for the sibling numbers, the larger the age gap is, the worse off a child could be. It also contradicts with our intuition that the larger age gap between siblings may allow parents to accumulate more savings or other resource to support a higher living standard for their children.
Apart from comparing cross families, we also adopt family fix effect to explore individual features that may influence on food allocation under one roof. First, boys did not perform better than the girls for a given household. Even in the most extreme cases that there was only one boy with all other female siblings, no boy preference has been detected. Furthermore, the importance of birth order in explaining a child’s health condition emerges. Apparently, later born children, regardless of sex, tend to be worse off compared with their older siblings, and this lines up with normal life cycle effect—more children with in one household naturally caused insufficient attention and food allocation for each one of them.
Figure 1: Effect of Sibling Order (Rank) on Children's Health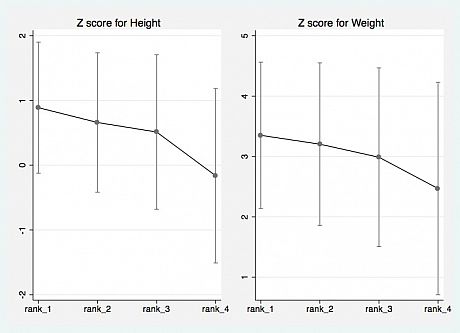
In short, children’s growth is deeply influenced by household structure, which determines how food, resource and housework are allocated to each child for a given household. Further investigation will be pursued and the data we newly collected will facilitate our exploration in our next step.
Pei Gao, July 2015
[1] Z-score is a standard deviation classification system provided by WHO, which is widely recognized as the best system for analysis and presentation of children’s anthropometric data.
[2] For instance, in the NSSD dataset, girls are more likely to be sent away to school when the family size is small, while with the household gets larger, more boys were sent to school, implying that girls may stay at home and take care housework.
- January 2015 - How has Children's Growth Changed over Time?
-
The past 150 years have seen a massive improvement in the health of populations in Europe and North America. People live longer, eat larger quantities of more nutritious food, get sick less often and have better access to healthcare and medical technology. These general improvements have led to a large increase in the average height of the population: 11 cm in Britain. This large increase in height made me wonder a few years ago whether and how children’s growth has changed over time. This blog post explains what we currently know about the differences between child growth today and in the past and why it is important to study changes in children’s growth over time.
So what defines children’s growth? Children do not grow at a constant rate; they grow fastest in the first four or five years of life and during their pubertal growth spurt, which occurs between ages 8 and 12 for girls and ages 11 and 15 for boys in modern, healthy populations. Figure 1 presents an idealized view of the speed at which children should grow based on the World Health Organization (WHO) standards. The speed at which a child grows, the length of his/her growing years, and the timing of his/her pubertal growth spurt all contribute to give each child a unique growth pattern. Thus, Figure 1 is the average growth pattern for healthy children today.
Figure 1: Growth velocity of boys and girls at different ages according the WHO standards.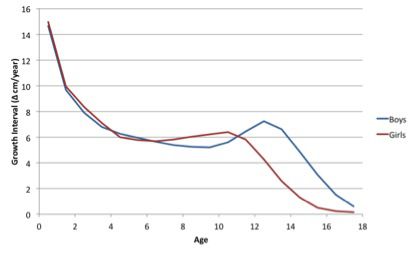
However, this modern, healthy growth pattern is very different than the growth pattern that we observe for European and North American children in the past. You might expect that if British adults in the mid-nineteenth century were 11 cm shorter, then children would just grow at a slower rate across all ages but maintain a similar timing of the pubertal growth spurt and length of the growing period. This is not the case. Children’s growth in the past was different in three ways:
- Children often grew at slower rates
- They grew for a much longer period of time than children today, finishing their growing period in their early twenties rather than late teens
- They also had a delayed pubertal growth spurt that was several years after their modern counterparts.
This historical growth pattern for European and North American children is similar to the growth pattern observed in developing countries today. Figure 2 shows the growth pattern for three populations of boys in North America in the late nineteenth century. You can see that each has slower growth before the age of 10, a delayed pubertal growth spurt and faster growth in the late teen than the WHO standard. This pattern is similar to British children in the same period. Thus, there has been a change in the growth pattern of children over the past 150 years.
Figure 2: Growth velocity of boys in the late nineteenth century compared to the WHO standards.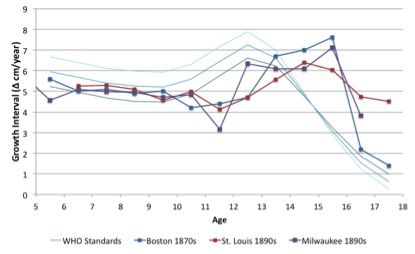
So why should we care about changes in the growth pattern? Understanding how child growth has changed and what contributed to these changes will not only improve our knowledge of health in the past but also contribute to current policy discussions. Stunting rates (the percentage of children who are short for their age) are commonly used as an indicator for malnutrition in the developing world. Thus, a long-run historical perspective will help us understand the long-run impacts of policies and interventions on stunting and the reasonable level of improvement in stunting that we can expect when setting development goals.
Thus, the purpose of this project is to reconstruct the growth pattern of British children from mid-nineteenth century to today using new and existing primary sources so that we can determine when changes in the growth pattern took place, how rapidly these changes took place and what caused the shift in the growth pattern over time.
Eric Schneider, January 2015