EXPERIMENT INFORMATION
Here, you will find links to the experiment information. Please click on either of the links below to access the relevant sections.
Monitoring the Experiment
Outcomes of Experiment 1997-2000
Outcome of Experiment 2005
Outcome of Experiment 2006
Monitoring of the experiment is being carried out by a research group
of Adult Learners from the Centre for Continuing Education at the
University of Sussex. Vegetation data was collected from the experimental
sites before the treatments commenced and this will be compared with
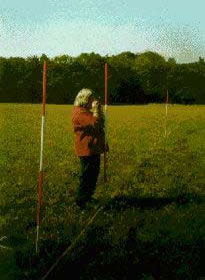
data collected in the same way in subsequent years. Quadrats were
set out in predetermined positions across the treatment areas using
a precision sighting compass. See Figure 1 below:
Figure 1 – Sighting compass being used
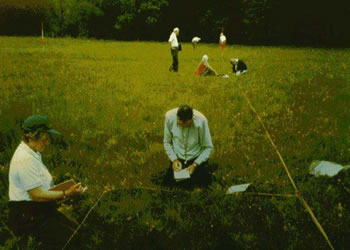
Percentage cover was recorded for all the plant species in each 2m
by 2m quadrat. See Figure 2 below:
Figure 2 – Students recording from Quadrats
TWINSPAN classification of this quadrat data showed a uniform distribution
of quadrat types in the different treatment areas at level 1 and level
2 . This distribution is expected to change in subsequent years as
the effects of the management treatments become apparent. See Figure
3 below:
Figure 3 – TWINSPAN Classification of quadrats in 1997
before commencement of treatment regimes
2. OUTCOMES OF EXPERIMENT– 1997-2000
OUTCOMES after 2 years of experiment
(Publication: Pilkington,M, 2000. Experimental aftermath grazing
of urban neutral grassland, in Grazing Management edited by Rook,
AJ and Penning, PD, BGS Occasional Symposium No 34, pp165-166.)
a) Aftermath grazed area of G5 meadow has less thatch and a more visually
appealing display of wildflowers than the ungrazed area. Yellow rattle
(Rhinanthus minor) is spreading within this part.
b) The introduction of limited aftermath grazing over the two years
of the experiment has led to changed perceptions, with council officials
and local people now keen to see aftermath grazing extended to the
other meadows.
c) Lessons have been learnt about the most cost effective method of
containing sheep on a public site used by dog-walkers. Vandalism of
the electric fencing used initially resulted in many hours of expensive
staff time. The post and stockproof wire fence used in the second
year proved to be much more satisfactory in spite of the higher initial
cost since there were no instances of sheep escaping. It was also
more acceptable to dog walkers.
OUTCOMES after 3 years of experiment for G5 meadow
Analysis of quadrat data shows higher percentage cover of wildflowers where aftermath grazing has taken place and lower percentage cover where organic fertiliser has been applied, but no significant difference for timing of haycut. (Paper entitled 'Proactive conservation monitoring of three management treatments for public understanding of meadow management' to be published in the next edition of Journal of Practical Ecology and Conservation).
3. OUTCOME OF EXPERIMENT 2005
a) The application of fertiliser was discontinued after 2000 and
in subsequent summers the Group recorded from six extra quadrats
in each of the remaining treatment areas in G5. This made it possible
to separate out the late cut that had been grazed from the late cut
that was not grazed. The idea was that the benefit of cutting late
and allowing seeds to ripen would only show up in the grazed area
because grazing was necessary to ensure that the ripe seeds made
contact with the soil and became seedlings. Unfortunately we were
unable to implement the grazing in the following two years (see Table
1), but since then we have had 3 consecutive years (2002, 2003 and
2004) with grazing.
Table 1 Implementation of grazing in the Experiment
| Year | G5 and G2 grazed in the previous autumn |
| 1997 | No – pre-treatment position |
| 1998 | Yes |
| 1999 | Yes |
| 2000 | Yes |
| 2001 | No |
| 2002 | No |
| 2003 | Yes |
| 2004 | Yes |
b) How well has the hay-cut been implemented in the Experiment?
There have been difficulties with implementing the target cutting
times in the two experimental fields: Old arable (G5) and Valebridge
Common Field (G2). The mid-July and mid-August cuts have usually
gone ahead reasonably on time, but the mid-September cut has rarely
been implemented within anything like reasonable time limits (table
2). There have been additional difficulties with the late cut because
after September the ground becomes too wet for heavy machinery
and the sward becomes damaged in places. This makes it difficult
to draw any conclusions about the late-cut.
Table 2 Implementation of Hay-cuts in the Experiment
Early-cut is scheduled for mid-July; mid-cut for mid-August; late-cut
for mid-September.
| Year | G5 Early-Cut | G5 Mid-Cut | G5 Late-Cut | G2 |
| 1997 | 21 July | 17 August | 17 September | 17 September |
| 1998 | 9 July | 8 August | 18 September | 18 September |
| 1999 | 15 July | 21 August | 28 October | 28 October |
| 2000 | 16 July | 24 August | 23 September | NO CUT |
| 2001 | 18 July | 1 September | 10 October | 10 October |
| 2002 | 18 July | 14 August | 10 September | 18 July |
| 2003 | 1 August | 31 August | 23 September | 1 August |
| 2004 | 27 July | 26 August | 27-31 October | 27 July |
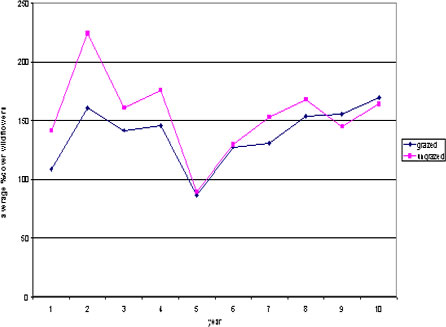
c) RESULTS of Experiment in G5
The percentage cover of wildflowers in the meadow increased the most
in areas where autumn grazing was combined with a mid-August hay-cut
rather than a mid-July cut (see graph 1). Two-way ANOVA on data from
the 72 quadrats surveyed in 2005 showed that the difference between
the areas was significant at the 0.1% level. There was no evidence
of interaction between grazing and cutting time. We are not able
to draw conclusions about the mid-September cut because this cut
was not been implemented satisfactorily.
Graph 1 Mean total cover of wildflowers in experimental areas of G5

d) RESULTS after 8 years of the Experiment for Valebridge Common
Field (G2)
Valebridge Common Field contrasts sharply with Old Arable. It was
much more flower-rich at the start of the experiment and even after
8 years in which grazing took place most years (see table 1), the
grazed half has not become significantly more flower-rich than the
ungrazed half. Instead the only significant result relates to the
absence of cutting in one year (2000 – see table 2) when the
percentage cover of wildflowers in both the grazed and the ungrazed
half of the meadow fell dramatically in the following year (2001
- see graph 2) and then recovered when cutting took place again.
Graph 2 Mean total cover of wildflowers in experimental areas of
G2
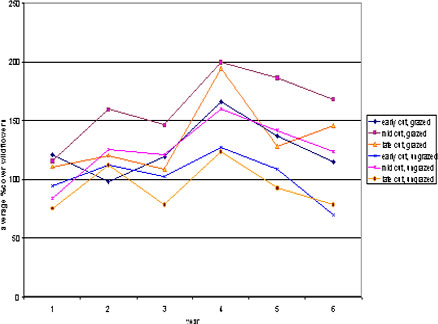
a) RESULTS of Experiment in G5
Data collection took place in Old Arable again in summer 2006 and
a very similar picture to 2005 emerged.
Graph 1 Mean total cover of wildflowers in experimental areas of G5, 2001-2006
b) The Experiment in Valebridge Common Field (G2)
The experiment in Valebridge Common Field entered a new phase in summer 2006
in response to changing ideas about how the meadows should be managed. An annual
hay-cut across all the meadows at Bedelands Farm is becoming increasingly difficult
for Mid Sussex District Council to implement. For the most species-rich meadows,
it is possible that topping followed by autumn grazing might be a suitable
alternative. This is being piloted in G2 which was topped in mid August in
2005 and 2006, and we are monitoring the effect of this, with and without autumn
grazing. The first data collection under the new regime took place in summer
2006. At this stage there was no significant difference between the grazed
and the ungrazed half of the meadow.
Graph 2 Mean total cover of wildflowers in experimental areas of G2, 1997-2006