
  SYMPTOM       OCCUPATION    AILMENT

  sneezing      nurse         flu
  sneezing      farmer        hayfever
  headache      builder       concussion
  headache      builder       flu
  sneezing      teacher       flu
  headache      teacher       concussion
sneezing builder ???
What ailment should we predict for a sneezing builder and why?
However, data often use using categorical values, i.e., names or symbols.
In this situation, it may be better to use a probabilistic method, such as the Naive Bayes Classifier (NBC).
  SYMPTOM       AILMENT

  sneezing      flu
  sneezing      hayfever
  headache      concussion
  sneezing      flu
  coughing      flu
  backache      none
  vomiting      concussion
  crying        hayfever
  temperature   flu
  drowsiness    concussion
  P(hayfever) = 2/10 = 0.2

  P(vomiting) = 1/10 = 0.1
As a simple, statistical model of the data, these (so-called prior) probabilities can be used for prediction.
Let's say we're undecided whether someone has flu or hayfever.
We can use the fact that P(flu) > P(hayfever) to predict it's more likely to be flu.
These are values we work out by looking at the probability of seeing one value given we see another, e.g., the probability of vomiting given concussion.
Conditional probabilites are notated using the bar `|' to separate the conditioned from the conditioning value.
The probability of vomiting given concussion is written
P(vomiting|concussion)We can work this value out by seeing what proportion of the cases involving concussion also show vomiting.
P(vomiting|concussion) = 1/3 = 0.3333
For example, we could tell someone who's known to have concussion that there's a 1/3 chance of them vomiting.
This can also be a way of generating diagnoses.
If someone reports they've been sneezing a lot, we can say there's a 2/3 chance of them having flu, since
P(flu|sneezing) = 2/3With slightly less likelihood (1/3) we could say they have hayfever, since
P(hayfever|sneezing) = 1/3
We might have something like this.
  SYMPTOM       OCCUPATION    AILMENT

  sneezing      nurse         flu
  sneezing      farmer        hayfever
  headache      builder       concussion
We'd like to be able to work out probabilities conditional on multiple symptoms, e.g.,
P(flu|sneezing,builder)But if a combination doesn't appear in the data, how do we calculate its conditional probability?
But we can work it out by looking at probabilities that do appear.
Observable probabilities that contribute to
P(flu|sneezing,builder)are
  P(flu)
  P(sneezing|flu)
  P(builder|flu)
All we need is some way of putting these together.
So assuming that sneezing has no impact on whether you're a builder, we can say that
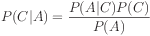
P(sneezing,builder|flu) = P(sneezing|flu)P(builder|flu)The probability of a sneezing builder having flu must depend on the chances of this combination of attributes indicating flu. So
P(flu|sneezing,builder)must be proportional to
P(flu)P(sneezing,builder|flu)
We need to factor in the probability of this combination of attributes associating with flu in particular, rather than some other ailment.
We do this by expressing the value in proportion to the probability of seeing the combination of attributes.
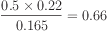
P(flu) = 0.5
P(sneezing|flu)=0.66
P(builder|flu)=0.33
P(sneezing,builder|flu)=(0.66x0.33)=0.22
P(sneezing)=0.5
P(builder)=0.33
P(sneezing,builder)=(0.5x0.33)=0.165
Plug values into the formula:
The more general version of Bayes rule deals with the
case where  is a class value, and the
attributes are
is a class value, and the
attributes are  .
.
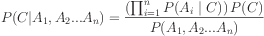
For each known class value,
We then get a probability of zero factored into the mix.
This may cause us to divide by zero, or simply make the final value itself zero.
The easiest solution is to ignore zero-valued probabilities altogether if we can.
However, the method has been shown to perform surprisingly well in a wide variety of contexts.
Research continues on why this is.